The two wheeled data acquisition machine
We really do live in the future. As I sit here in 2026 I have 4 bikes in my garage that aren’t just bikes they are essntially data acquisition computers. They are outfitted with technology that just a few years ago was impossible for spacecraft let alone a human powered have-fun machine. It’s crazy how far technology has come - For example, my bike has an onboard strain gauge that measures my leg power 1000 times a second, transmits it to a head unit who remembers it on non-volatile memory until the ride is done, at which time it transmits it over wifi to the cloud where the data is normalized, and compared near instantly against previous efforts and finally I see output to see how badly having that cheeseburger hurt my FTP. This article is about the state of the art in consumer data acquisition that is available on your bike today, and a practical guide to what you can do with the data.
Let’s follow the chain of data creation from source to consumption. There are a few main types of sensors that are popular, are reasonable cost, and provide very helpful information.
First and foremost is the head unit. Garmin, Wahoo, and Hammerhead are popular options - typically these units run on battery, have small screens for output of stats or navigation, have internal GPS sensors, accelerometers, temperature sensors, among a few others. They are the central computer of your bike, and generally required to use the other sensors. These head units can work alone, or can be augmented with other sensors. These other sensors typically use ANT+ or BLE protocols to send data to the head unit without bulky cables. Further, the latest generation of battery powered drivetrain, droppers, and accessories can also link to your head unit. They are becoming mega functional and useful for many things - they can even make a bell sound so you don’t need a physical bell.
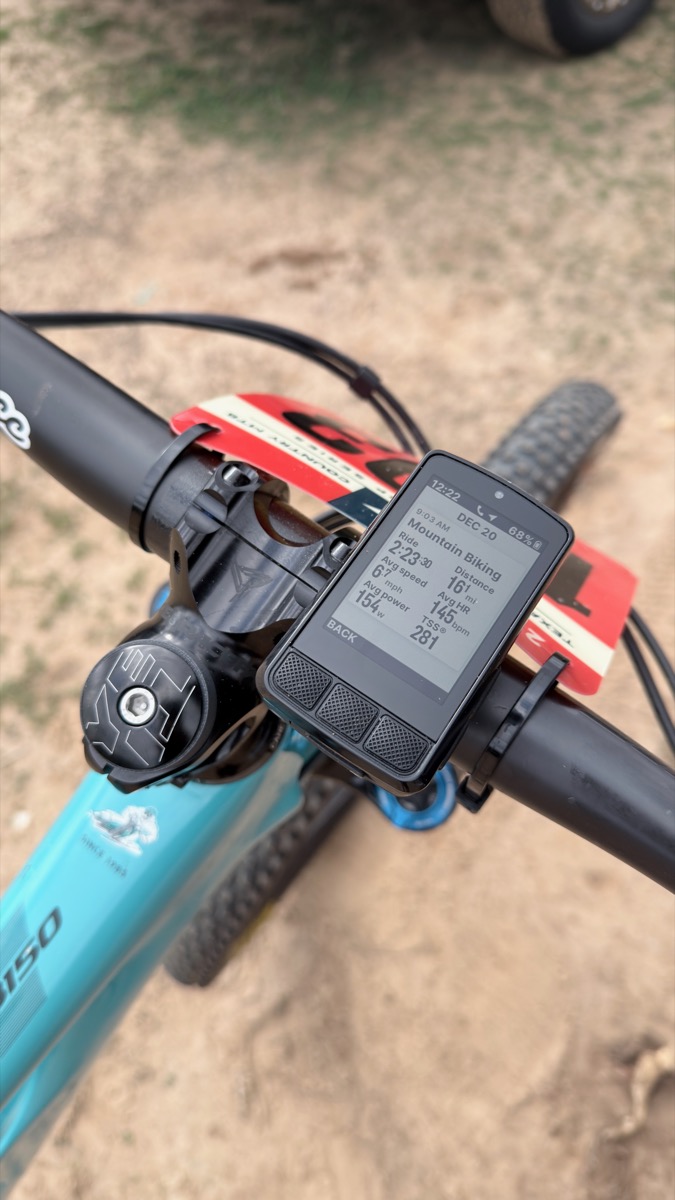 a Wahoo head unit - the heart of the system
Now there are a few other key sensors - a heart rate monitor is key. It’s going to provide data showing how hard you are working by measuring your heart rate. Typically these measure at 1Hz or once per second. This data is captured and sent wirelessly to your head unit.
Next there are power meters. These are devices that measure the force you are able to exert on the cranks. Typically a strain gauge built into your cranks, battery powered, and again wirelessly transmit the data to the head unit. These typically sample at 500Hz or more. They capture torque (force) and cadence (pedal speed, not bike speed) allowing for the output to be represented in Watts (Force x Velocity).
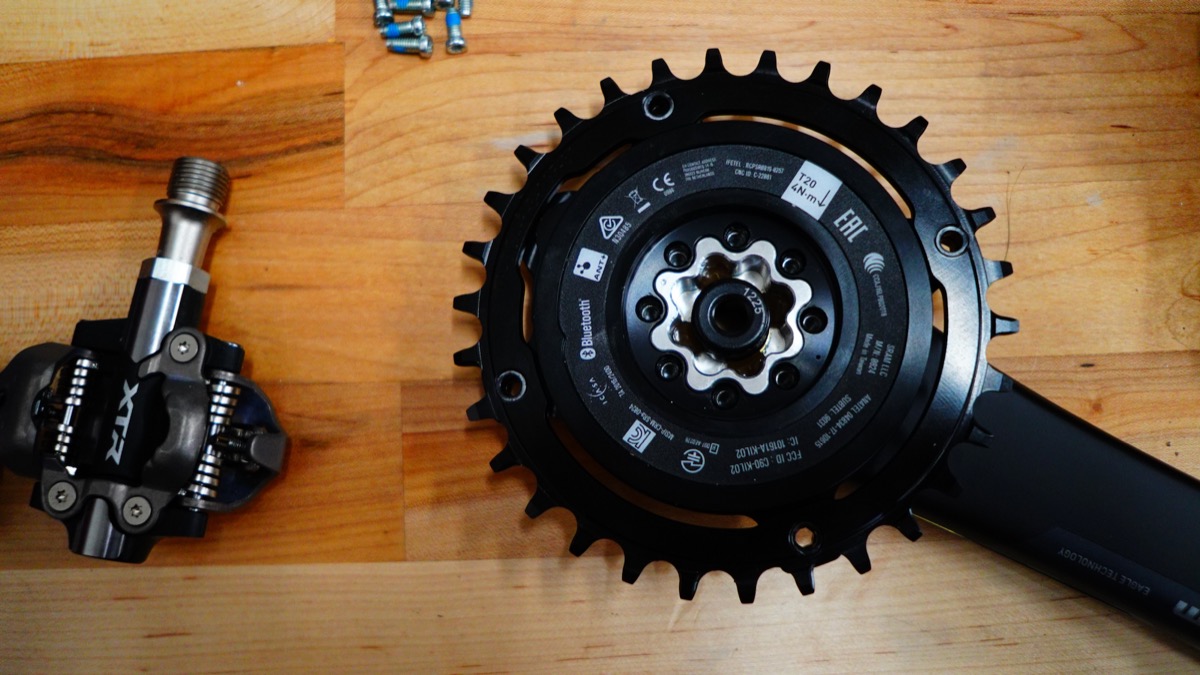 the SRAM Quarq power meter spider. Pure Sex
These are our core metrics:
- Speed. GPS speed from the head unit, or via wheel sensors, or calculated on ebikes via the mandatory wheel sensors.
- Location. Lat/Lon/Altitude comes from GPS.
- Time: Again, from GPS.
- Acceleration/deceleration comes from the Accelerometer.
- Rider output in Watts from the power meter.
- Rider cadence again from the power meter.
- Rider effort - the heart rate monitor.
With those core inputs, we can derive a ton of super useful metrics. Often times simple metrics are displayed on your head unit (like power, or cadence or speed), but once the ride is over systems like Strava or Intervals.icu can analyze these base metrics, compare them to historical metrics and calculate 2nd order metrics like fatigue, FTP, and so on.
Programs like intervals.icu can now be used to evaluate your training or fitness over time. It doesn’t matter if you are a casual rider or training for an ultra distance bikepacking adventure, it’s super useful to know how good of shape you are in, and if you are improving over time or not.
Let’s dive into these 2nd order metrics:
TSS (Training Stress Score): A proprietary metric developed by TrainingPeaks that quantifies the training load of a workout. It’s calculated using your Normalized Power, Intensity Factor, and ride duration. A one-hour ride at FTP equals 100 TSS. The score accounts for both intensity and duration - a hard 30-minute effort might be 50 TSS, while an easy three-hour ride could be 150 TSS.
FTP (Functional Threshold Power): The highest average power you can sustain for approximately one hour, measured in watts. It represents the boundary between steady-state effort and unsustainable accumulation of lactate. Used as the baseline for calculating training zones and intensity.
CTL (Chronic Training Load): Also called “Fitness” in many platforms. A 42-day exponentially weighted average of your daily TSS. It represents your long-term training load and overall aerobic fitness. Higher CTL means you’ve been consistently training. It rises slowly with sustained training and declines slowly with rest.
ATL (Acute Training Load): Also called “Fatigue.” A 7-day exponentially weighted average of daily TSS. Represents your recent training stress and short-term fatigue.
TSB (Training Stress Balance): CTL minus ATL. Shows whether you’re fresh (positive TSB) or fatigued (negative TSB). Form.
HR Decoupling: Also called cardiac drift. When power output remains constant but heart rate continues to climb, or when heart rate stays elevated despite reduced power output. Typically indicates dehydration, glycogen depletion, or heat stress. A decoupling of more than 5% over the course of a ride suggests inadequate fueling or hydration.
Normalized Power (NP): A weighted average power that accounts for the physiological cost of variation in power output. Unlike simple average power, NP reflects that surges and intervals are more costly than steady efforts. A ride with lots of attacks will have higher NP than average power.
Intensity Factor (IF): Your Normalized Power divided by FTP, expressed as a decimal. Provides a quick view of relative effort intensity - 0.75 is moderate endurance, 0.85-0.95 is tempo to threshold, 1.05+ is race or breakthrough effort.
Variability Index (VI): The ratio of Normalized Power to Average Power. A perfectly steady ride = 1.00. Higher numbers (1.10+) indicate surging, attacking, variable terrain. Shows how smooth or chaotic your power delivery was.
Power-to-Weight Ratio (W/kg): Your FTP divided by body weight in kilograms. Critical metric for climbing performance. A 250-watt FTP means something very different at 90kg versus 70kg.
HRV (Heart Rate Variability): Not captured during the ride, but pulled from wearables or morning measurements. Reflects autonomic nervous system recovery state. Lower HRV suggests accumulated fatigue or stress; higher HRV indicates readiness to train hard.
Ramp Rate: The rate at which your CTL (fitness) is increasing, measured in TSS per week. General guideline suggests keeping ramp rate under 5-8 TSS per week to avoid injury or overtraining.
Wow right? Don’t get overwhelmed. Let me lead you through how I use this data in my every day riding. If you haven’t caught it yet, I am a seasoned rider and novice racer. I am keen on monitoring my fitness and output, I want to improve my power to weight ratio so my friends don’t drop me, and I want to enter and race races not just survive. I suspect this is like many of you. So my usage isn’t the same as someone doing the Tour Divide or Unbound.
For my setup I run SRAM Quarq power meters, the SB140 has a spider mounted one, and the Santa Cruz Stigmata Gravel bike has crank mounted ones (it actually came power meter ready, it just needed an add-on crank arm). Either way they transmit the data to my Wahoo ELEMNT BOLT 3. You can use one computer on multiple bikes, so that’s nice - I move mine from bike to bike. On the Yeti MTe and Santa Cruz Skitch, they are ebikes, so they transmit torque and cadence from the motor (they measure the effort I am putting in AND the motor itself as well). So all my bikes have some way of seeing power, cadence. Next I use a Wahoo TRACKR Heart Rate Monitor Chest Strap to get heart rate.
So that setup provides the sensors to capture my core metrics. Now let’s use this data in some meaningful way to help me on my goals.
- I ride each week to a TSS number. Right now I am doing about 400 TSS a week. In other words to keep losing weight, getting a better power to weight ratio I need to keep that level of intensity. This value scales with me, in other words, if I just tracked something like calories output over time that number would go down as I got in better shape. TSS scales as I do, I can keep at 400 and know roughly how I am going to feel each week even as I get better (tired as hell).
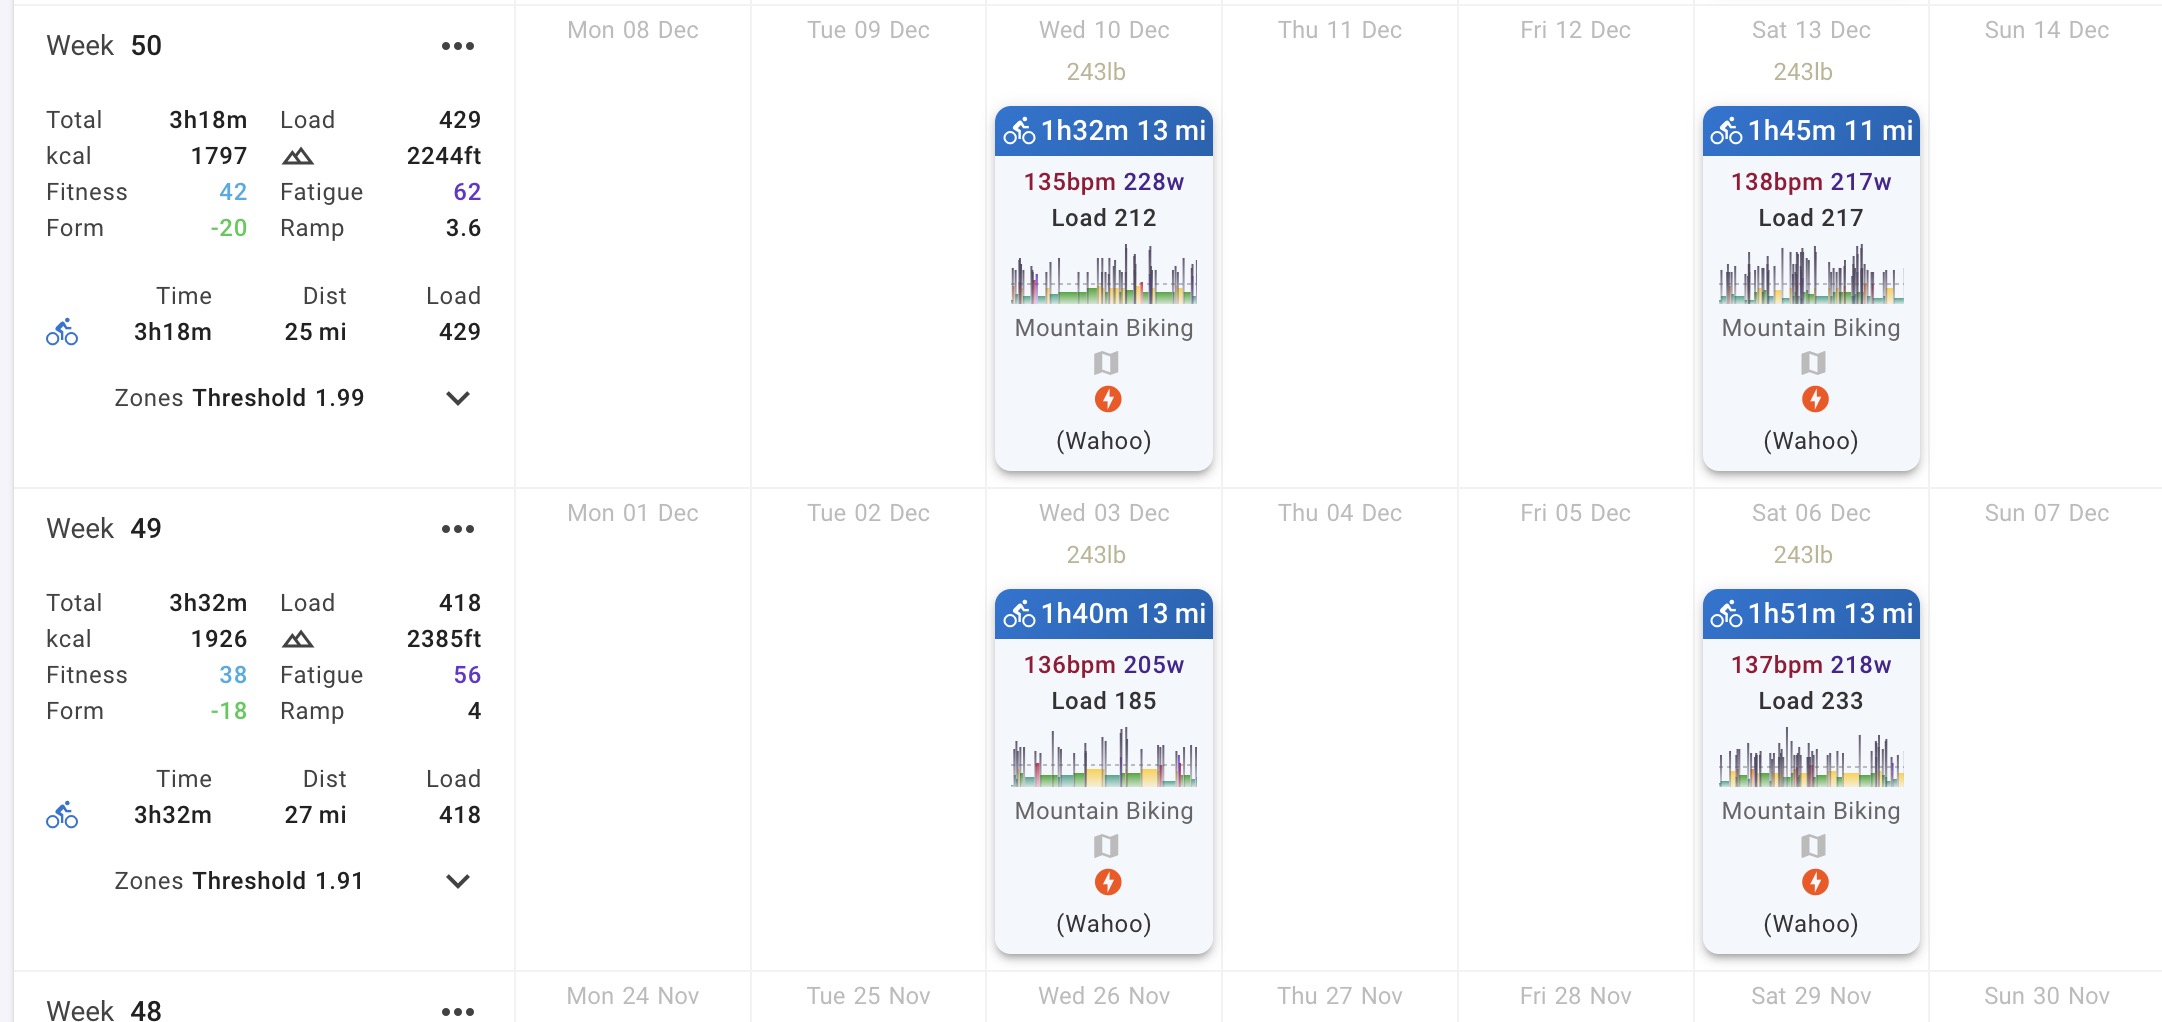 weekly load showing about 400
- TSB (or CTL/ATL). I use these two metrics to measure if I am going to feel like shit on the next ride or actively manage it leading into a race. For example I will want to make sure I have a positive TSB before race day, and I might train light, do a simple spin, or whatever it takes so I stay positive TSB and don’t blow myself up right before a race.
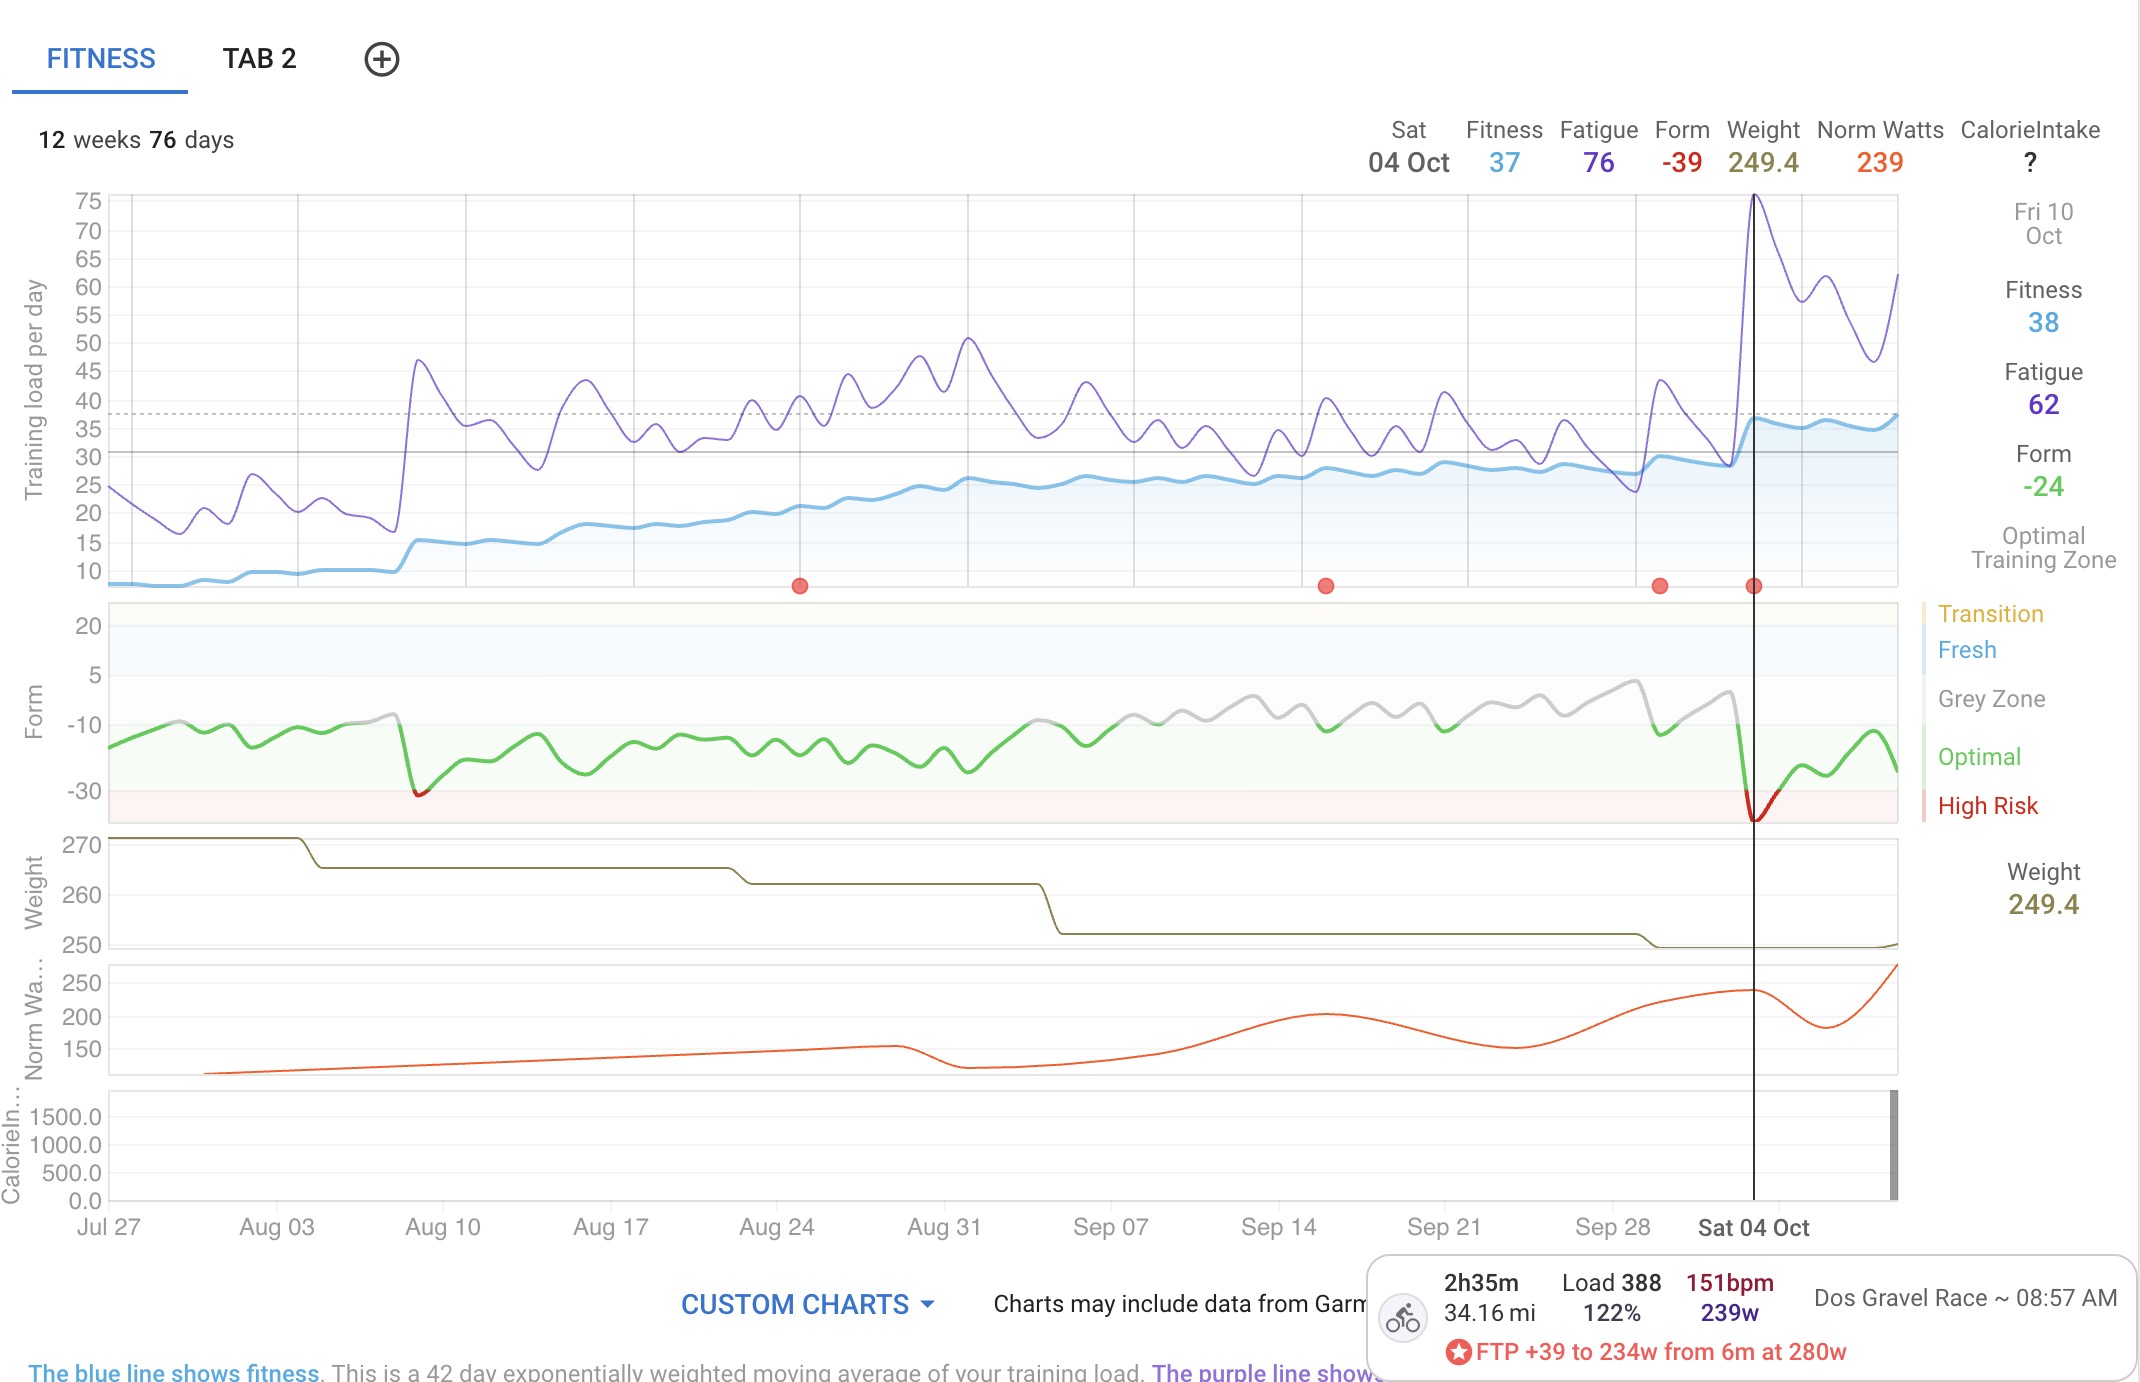 my training data leading up to the Dos Gravel Race
-
HR Decoupling. I use this to see if I am feeding properly during a race. One of my key learnings from Boots and the Rattler race is, I can do better than I thought if I keep feeding/hydrated and that I don’t decouple during a race. This metric is a lookback - I look at past races or rides and make adjustments. It’s not something you can do while you are in the race - at that point if you decouple it’s too late.
-
IF. I look at this just to validate the ride was hard. Sometimes a ride just feels hard or for whatever reason you are just rocking it. I might also think about what I had for dinner the night before or how I fueled during a ride or the weather. I’ve noticed if it’s hot, the IF skyrockets for example.
-
Power to weight ratio. Lastly, this metric is my north star. To calculate this you need your weight. Notice I didn’t talk about scales here - I manually enter my weight into intervals.icu so this calculation can be done. Power to weight is measuring me to my goal of overall fitness and health. It’s both losing weight AND getting stronger in one metric.
Ok that’s it, that’s how, at least for now, I use all this data to become a better rider, try not to get dropped, and have more fun on the bike.
I’ll have a follow-on post about how to use intervals.icu - the good, the bad, and the ugly.